By Malcolm McDonald, Emeritus Professor of Marketing, Cranfield University School of Management
Our definition of a value proposition is “the translation of the supplier’s offers into monetary terms that demonstrate their contribution to the customer’s profitability.” The key phrase here is “customer profitability,” because if you can prove that dealing with you will make your customer richer, they will buy from you.
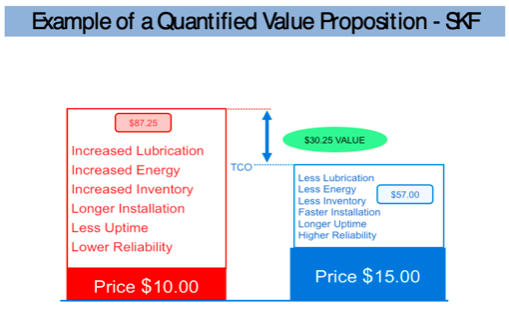
Even a cursory glance at the pricing example below from global engineering group SKF illustrates the dramatic impact that is possible as a result of preparing financially quantified value propositions.